pgv-simpleplot CLI Document
pgv-simpleplot is one of the CLI workflows in pyGenomeViz for simple genome visualization.

Usage
Basic Command
pgv-simpleplot --gbk_resources seq1.gbk seq2.gbk seq3.gbk seq4.gbk -o result.html
Options
General Options:
  --gbk_resources IN [IN ...]  Input genome genbank file resources
                               User can optionally specify genome range and reverse complement.
                               - Example1. Set 100 - 1000 range 'file:100-1000'
                               - Example2. Set reverse complement 'file::-1'
                               - Example3. Set 100 - 1000 range of reverse complement 'file:100-1000:-1'
  -o OUT, --outfile OUT        Output file ('*.png'|'*.jpg'|'*.svg'|'*.pdf'|'*.html')
  -v, --version                Print version information
  -h, --help                   Show this help message and exit

Figure Appearence Options:
  --fig_width                  Figure width (Default: 15)
  --fig_track_height           Figure track height (Default: 1.0)
  --feature_track_ratio        Feature track ratio (Default: 1.0)
  --space_track_ratio          Space (b/w feature) track ratio (Default: 2.0)
  --tick_track_ratio           Tick track ratio (Default: 1.0)
  --track_labelsize            Track label size (Default: 20)
  --tick_labelsize             Tick label size (Default: 15)
  --align_type                 Figure tracks align type ('left'[*]|'center'|'right')
  --tick_style                 Tick style ('bar'|'axis'|None[*])
  --feature_plotstyle          Feature plot style ('bigarrow'[*]|'arrow')
  --arrow_shaft_ratio          Feature arrow shaft ratio (Default: 0.5)
  --feature_color              Feature color (Default: 'orange')
  --feature_linewidth          Feature edge line width (Default: 0.0)
  --dpi                        Figure DPI (Default: 300)

[*] marker means the default value.
Examples
Example 1
Download example dataset:
Download four Enterobacteria phage genbank files
pgv-download-dataset -n enterobacteria_phage
Run CLI workflow:
pgv-simpleplot --gbk_resources NC_019724.gbk -o simpleplot_example1.png

Example 2
Download six Enterobacteria phage genbank files
pgv-download-dataset -n enterobacteria_phage
Run CLI workflow:
pgv-simpleplot --gbk_resources NC_019724.gbk NC_024783.gbk NC_016566.gbk NC_013600.gbk NC_031081.gbk NC_028901.gbk \
               -o simpleplot_example2.png --tick_style axis --feature_plotstyle arrow --fig_track_height 0.7
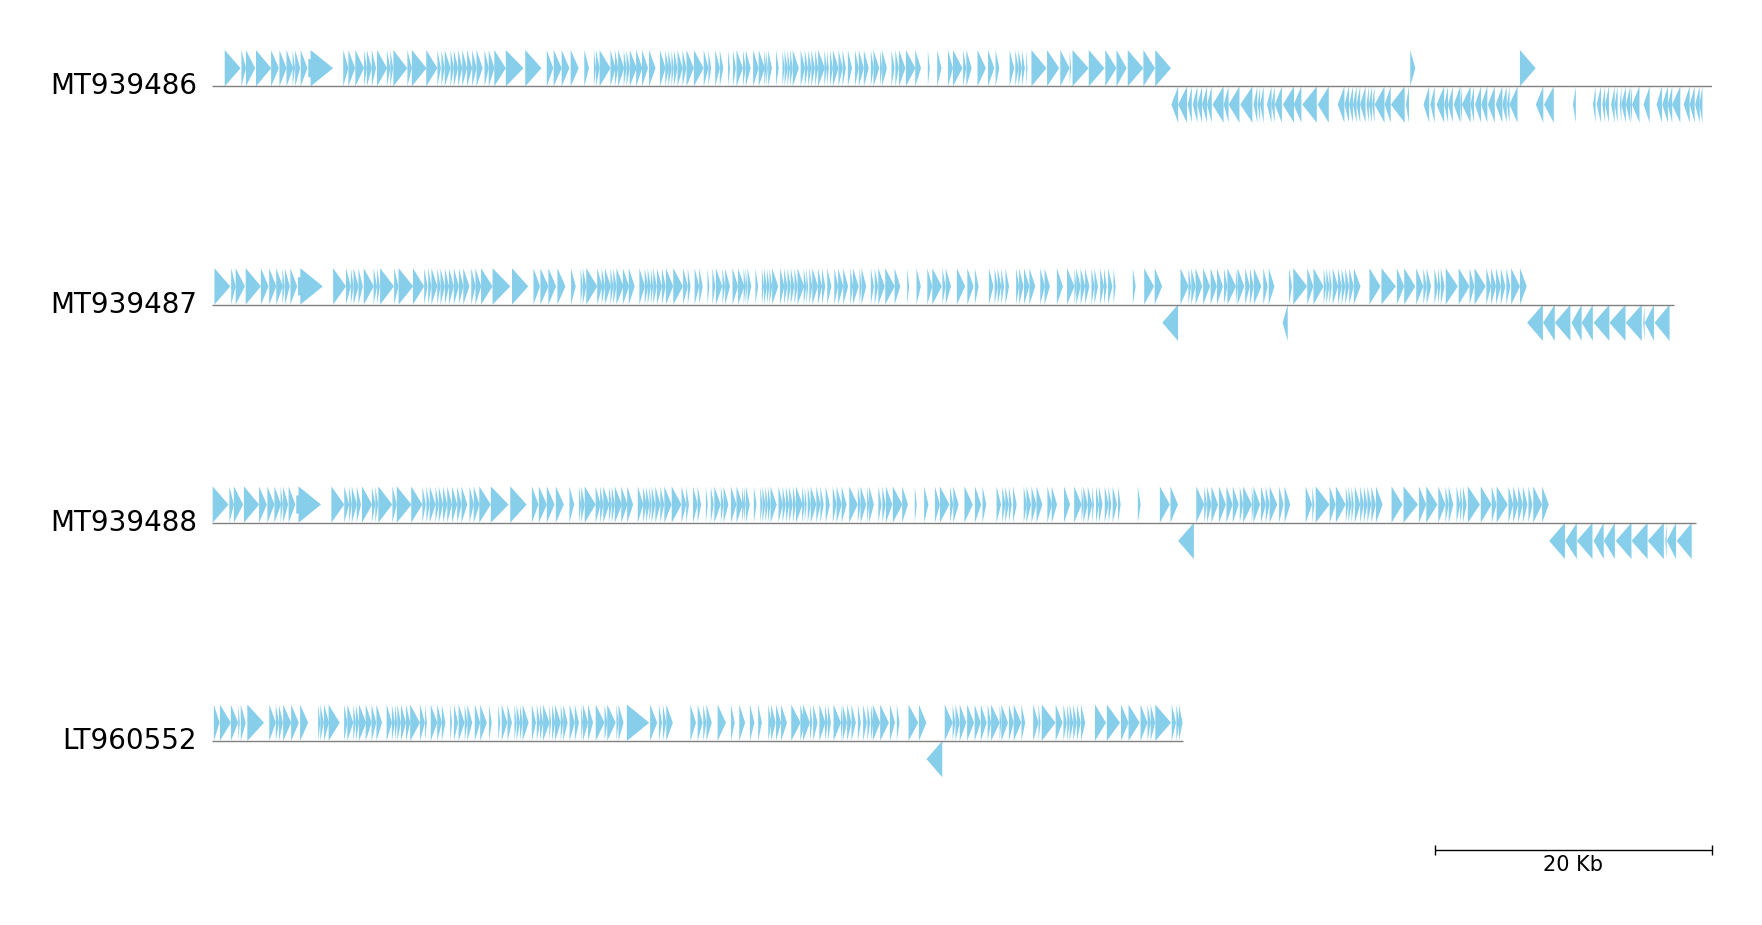
Example 3
Download example dataset:
Download four Erwinia phage genbank files
pgv-download-dataset -n erwinia_phage
Run CLI workflow:
Target range is specified (e.g. file:100-1000)
pgv-simpleplot --gbk_resources MT939486.gbk:250000-358115 MT939487.gbk:250000-355376 MT939488.gbk:250000-356948 LT960552.gbk:270000-340000 \
               -o simpleplot_example3.png --tick_style bar --feature_plotstyle arrow --feature_color skyblue