pgv-pmauve
pgv-pmauve is one of the CLI workflows in pyGenomeViz for
visualization of genome alignment results using progressiveMauve.
It can be used to visualize commonly conserved regions between all genomes.
Installation
Conda
conda install -c conda-forge -c bioconda pygenomeviz progressivemauve
Pip
pip install pygenomeviz
Additional installation of progressiveMauve is required. On Ubuntu, progressiveMauve can be installed with apt command.
sudo apt install progressivemauve
Docker
docker run -it --rm -p 8501:8501 ghcr.io/moshi4/pygenomeviz:latest pgv-pmauve -h
Usage
$ pgv-pmauve --help
usage: pgv-pmauve [options] seq1.gbk seq2.gbk seq3.gbk -o outdir

pyGenomeViz CLI workflow using progressiveMauve

positional arguments:
  seqs                    Input genbank or fasta files

General Options:
  -o , --outdir           Output directory
  --formats               Output image format ('png'[*],'jpg','svg','pdf',`html`[*])
  --reuse                 Reuse previous alignment result if available
  -q, --quiet             No print log on screen (default: OFF)
  -v, --version           Print version information
  -h, --help              Show this help message and exit

Figure Appearence Options:
  --fig_width             Figure width (Default: 15)
  --fig_track_height      Figure track height (Default: 1.0)
  --track_align_type      Figure tracks align type ('left'|'center'[*]|'right')
  --feature_track_ratio   Feature track ratio (Default: 0.25)
  --show_scale_bar        Show scale bar (Default: OFF)
  --show_scale_xticks     Show scale xticks (Default: OFF)
  --curve                 Plot curved style link (Default: OFF)
  --dpi                   Figure DPI (Default: 300)
  --track_labelsize       Track label size (Default: 20)
  --scale_labelsize       Scale label size (Default: 15)
  --normal_link_color     Normal link color (Default: 'grey')
  --inverted_link_color   Inverted link color (Default: 'red')
  --refid                 Reference genome index (Default: 0)
  --block_plotstyle       Synteny block plot style ('box'[*]|'bigbox')
  --block_cmap            Synteny block colormap (Default: 'gist_rainbow')

[*] marker means the default value.
Multi Contigs Input Case
progressiveMauve cannot align for multiple contigs. Therefore, when multiple contigs are included in the input, a sequence that concatenates the multiple contigs into one is used as the input.
Colormap(--block_cmap) Option
User can arbitrarily choose the visualization colormap from
the various colormap types in matplotlib.
See Choosing Colormaps in Matplotlib for details.
Examples
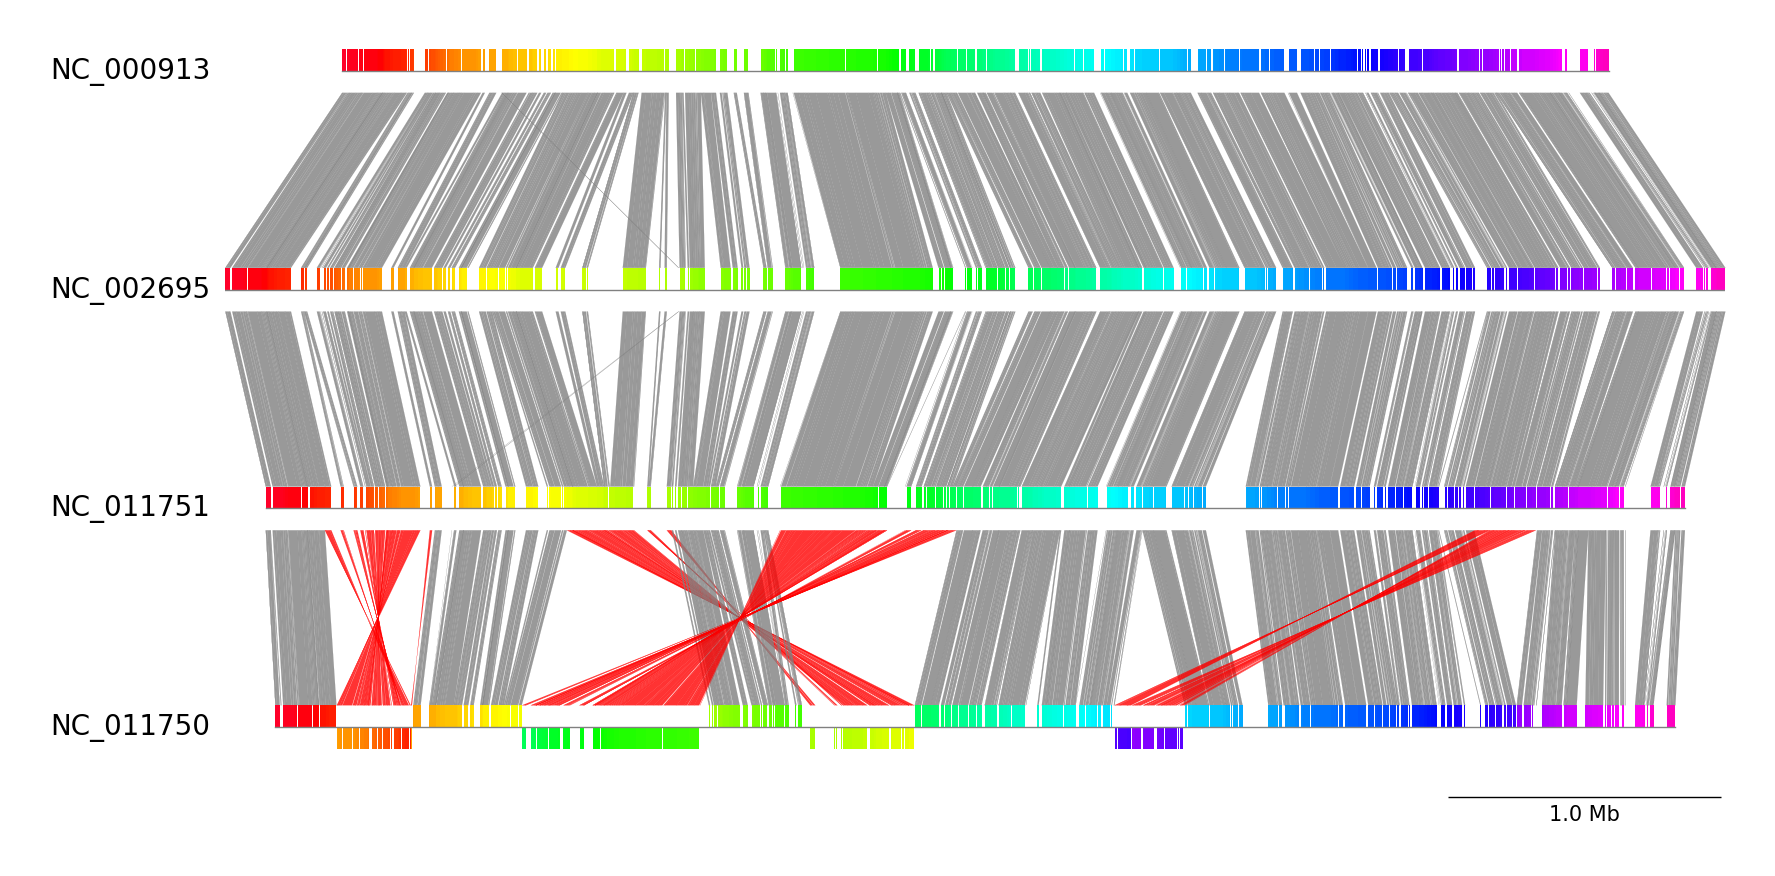
Example 1
Download example dataset:
pgv-download escherichia_coli
Run CLI workflow:
pgv-pmauve NC_000913.gbk.gz NC_002695.gbk.gz NC_011751.gbk.gz NC_011750.gbk.gz \
           -o pgv-pmauve_example1 --show_scale_bar
Example 2
Download example dataset:
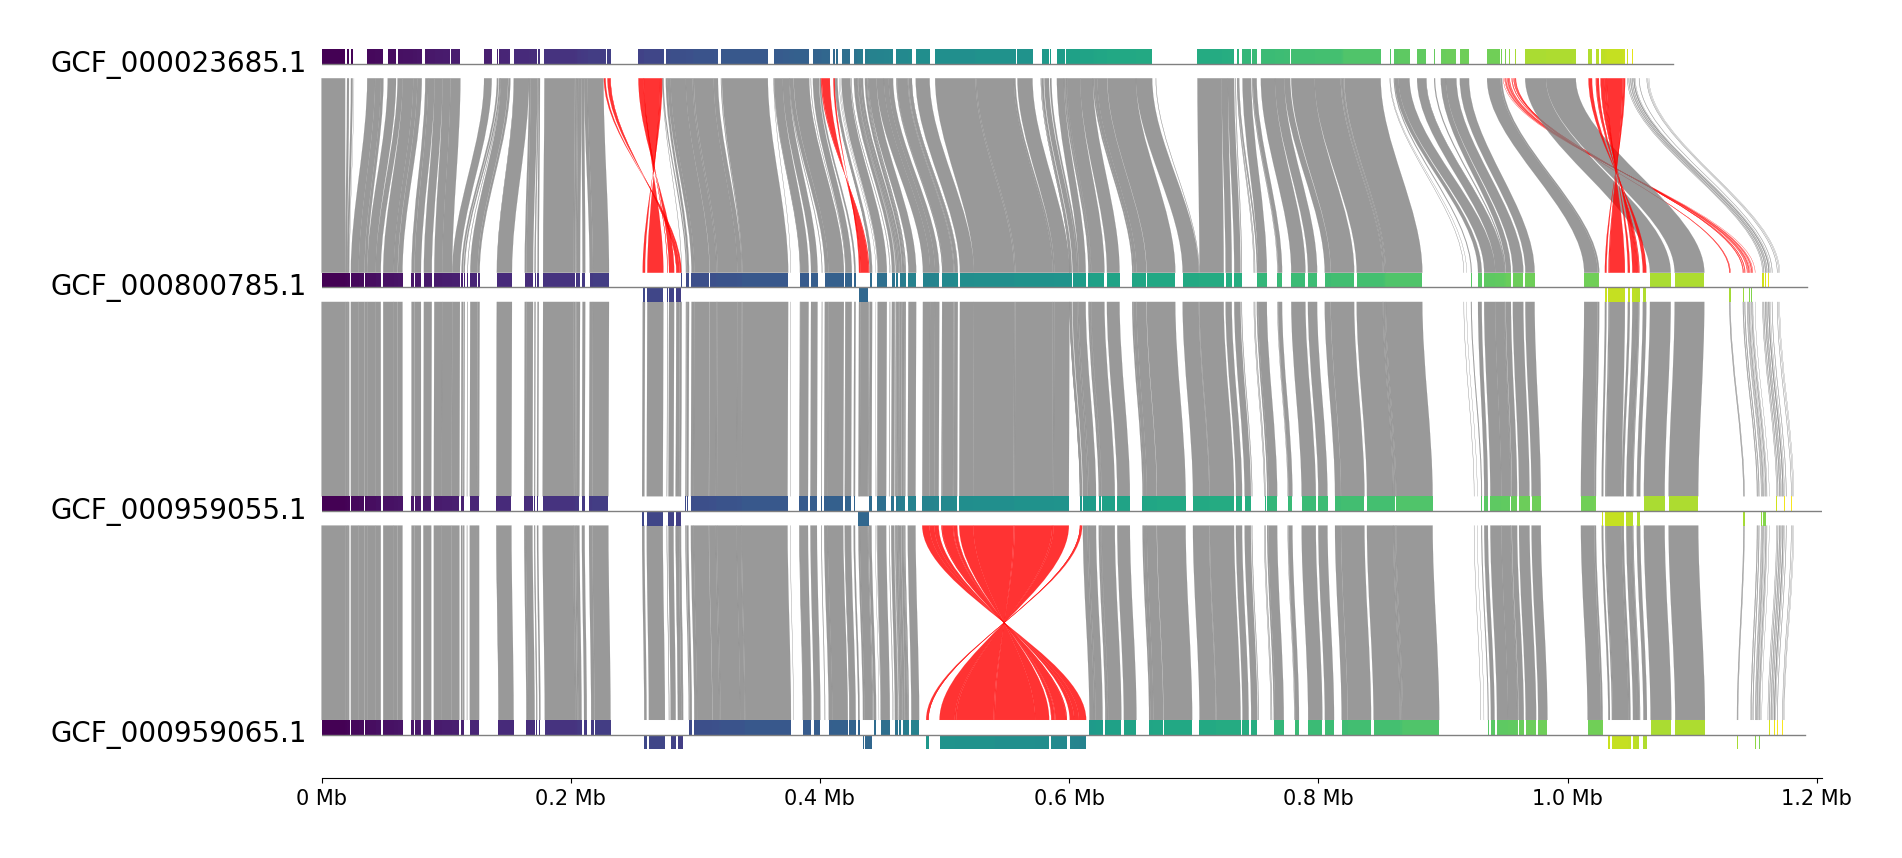
pgv-download mycoplasma_mycoides
Run CLI workflow:
pgv-pmauve GCF_000023685.1.gbff GCF_000800785.1.gbff GCF_000959055.1.gbff GCF_000959065.1.gbff \
           -o pgv-pmauve_example2 --feature_track_ratio 0.15 --block_cmap viridis --track_align_type left \
           --show_scale_xticks --curve