pgv-mummer
pgv-mummer is one of the CLI workflows in pyGenomeViz for
visualization of genome alignment using MUMmer(nucmer, promer).
Installation
Conda
conda install -c conda-forge -c bioconda pygenomeviz mummer
Pip
pip install pygenomeviz
Additional installation of MUMmer is required. On Ubuntu, MUMmer can be installed with apt command.
sudo apt install mummer
Docker
docker run -it --rm -p 8501:8501 ghcr.io/moshi4/pygenomeviz:latest pgv-mummer -h
Usage
$ pgv-mummer --help
usage: pgv-mummer [options] seq1.gbk seq2.gbk seq3.gbk -o outdir

pyGenomeViz CLI workflow using MUMmer (nucmer, promer)

positional arguments:
  seqs                    Input genbank files

General Options:
  -o , --outdir           Output directory
  --formats               Output image format ('png'[*],'jpg','svg','pdf',`html`[*])
  --reuse                 Reuse previous alignment result if available
  -q, --quiet             No print log on screen (default: OFF)
  -v, --version           Print version information
  -h, --help              Show this help message and exit

MUMmer Alignment Options:
  --seqtype               Alignment sequence type ('nucleotide'[*]|'protein')
  --threads               Threads number (Default: MaxThread - 1)
  --length_thr            Length threshold to be plotted (Default: 0)
  --identity_thr          Identity threshold to be plotted (Default: 0)

Figure Appearence Options:
  --fig_width             Figure width (Default: 15)
  --fig_track_height      Figure track height (Default: 1.0)
  --track_align_type      Figure tracks align type ('left'|'center'[*]|'right')
  --feature_track_ratio   Feature track ratio (Default: 0.25)
  --show_scale_bar        Show scale bar (Default: OFF)
  --show_scale_xticks     Show scale xticks (Default: OFF)
  --curve                 Plot curved style link (Default: OFF)
  --dpi                   Figure DPI (Default: 300)
  --track_labelsize       Track label size (Default: 20)
  --scale_labelsize       Scale label size (Default: 15)
  --normal_link_color     Normal link color (Default: 'grey')
  --inverted_link_color   Inverted link color (Default: 'red')
  --segment_space         Track segment space ratio (Default: 0.02)
  --feature_type2color    Feature plot type & color (Default: ['CDS:orange'])
  --pseudo_color          Pseudo feature plot color (Default: 'lightgrey')
  --feature_plotstyle     Feature plot style ('[big]arrow'[*]|'[big]box'|'[big]rbox')
  --feature_linewidth     Feature line width (Default: 0.0)
  --feature_labeltrack    Feature label target track ('top'[*]|'all')
  --feature_labeltype     Feature label type ('product'|'gene'|'protein_id'|'None'[*])
  --feature_labelsize     Feature label size (Default: 8)
  --cbar_width            Colorbar width (Default: 0.01)
  --cbar_height           Colorbar height (Default: 0.2)

[*] marker means the default value.
--seqtype Option
--seqtype nucleotide: nucmer, --seqtype protein: promer
Examples
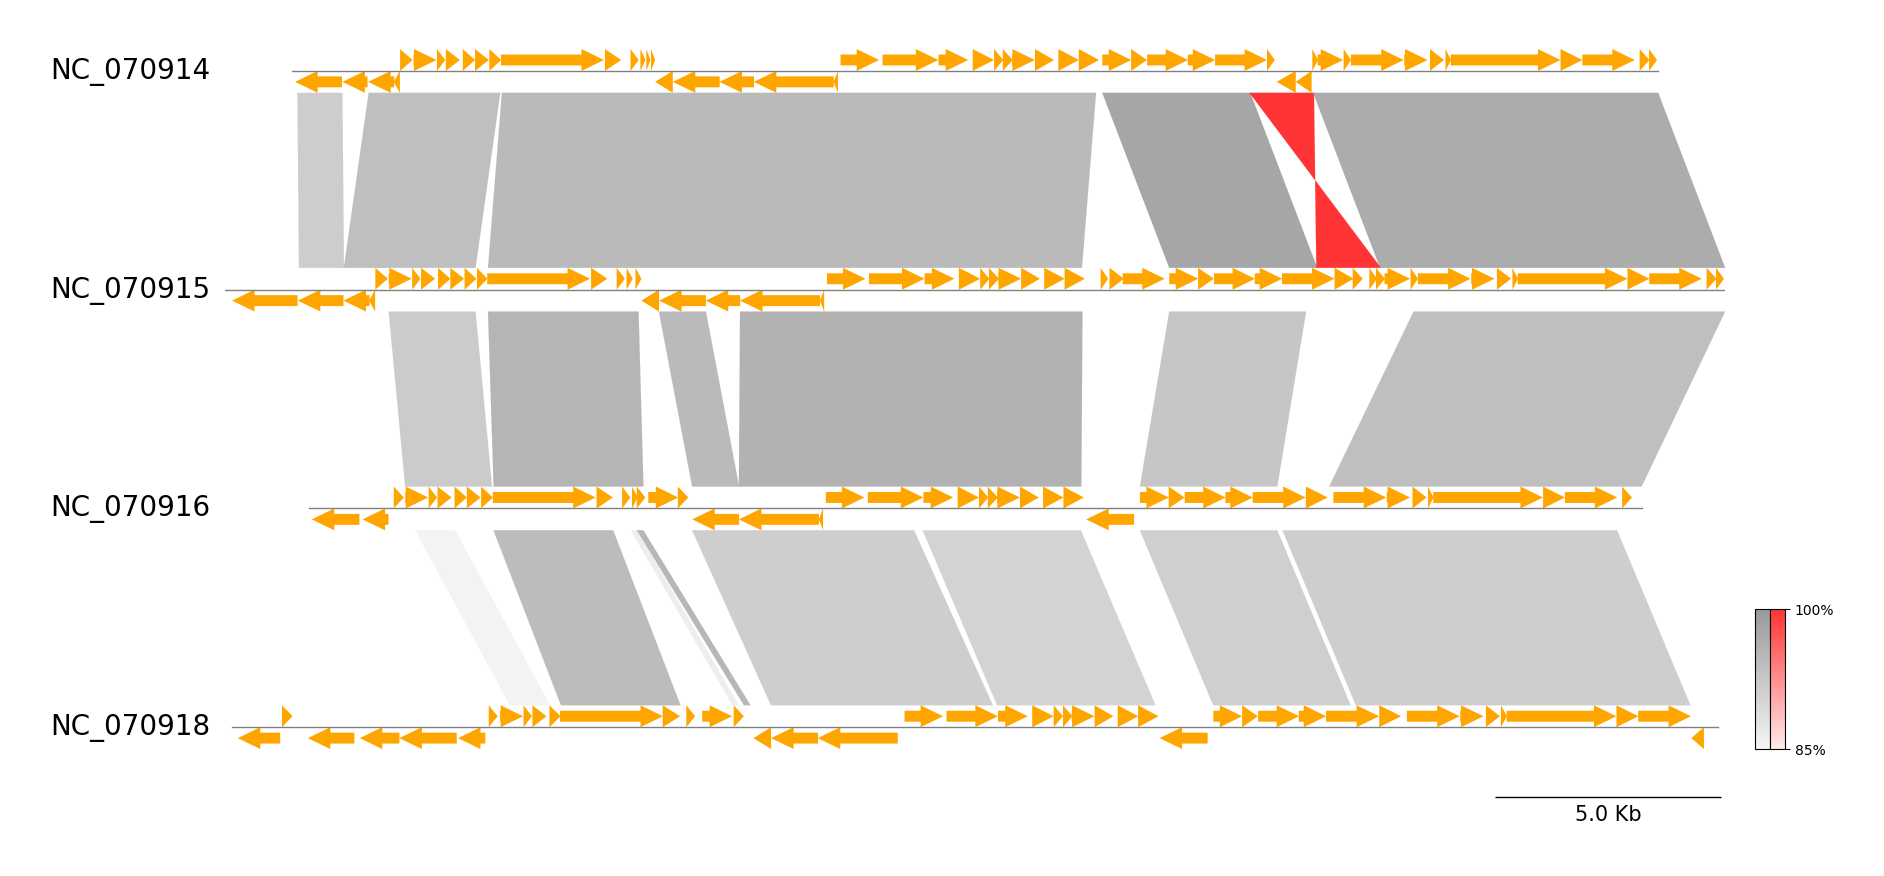
Example 1
Download example dataset:
pgv-download yersinia_phage
Run CLI workflow:
pgv-mummer NC_070914.gbk NC_070915.gbk NC_070916.gbk NC_070918.gbk \
           -o pgv-mummer_example1 --show_scale_bar
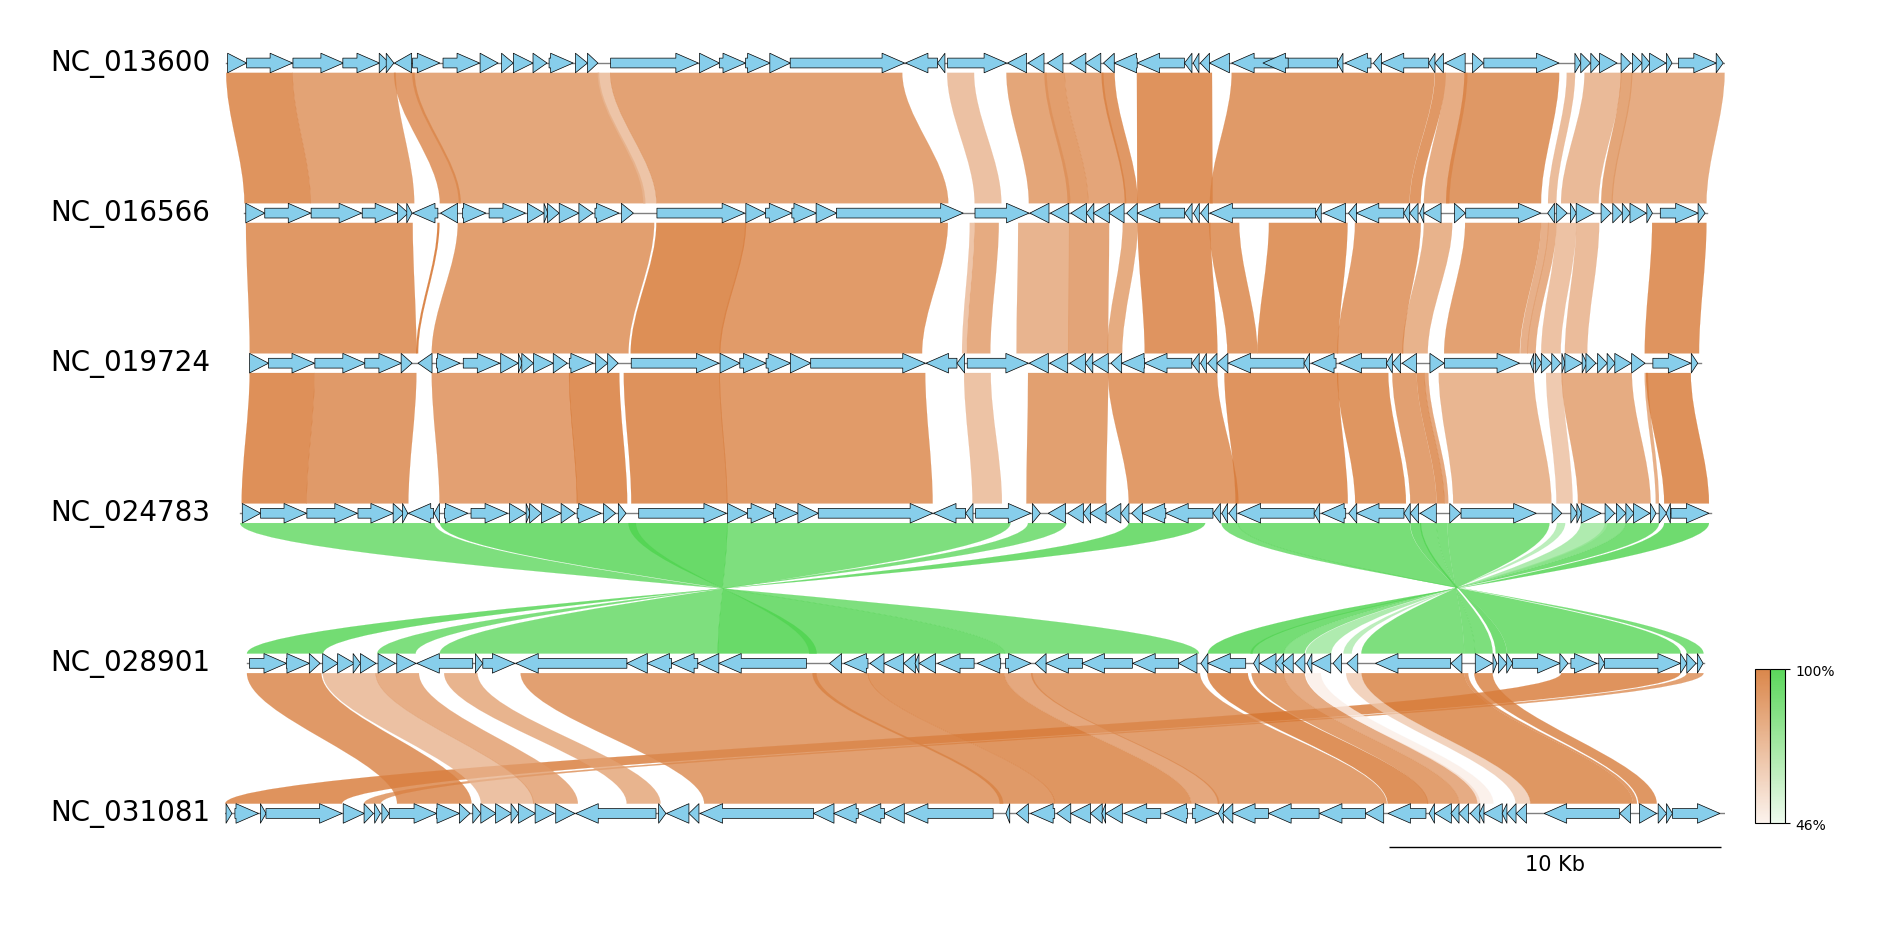
Example 2
Download example dataset:
pgv-download enterobacteria_phage
Run CLI workflow:
pgv-mummer NC_013600.gbk NC_016566.gbk NC_019724.gbk NC_024783.gbk NC_028901.gbk NC_031081.gbk \
           -o pgv-mummer_example2 --seqtype protein --show_scale_bar --curve \
           --feature_track_ratio 0.15 --fig_track_height 0.7 --feature_linewidth 0.5 --feature_plotstyle bigarrow \
           --feature_type2color CDS:skyblue --normal_link_color chocolate --inverted_link_color limegreen
Example 3
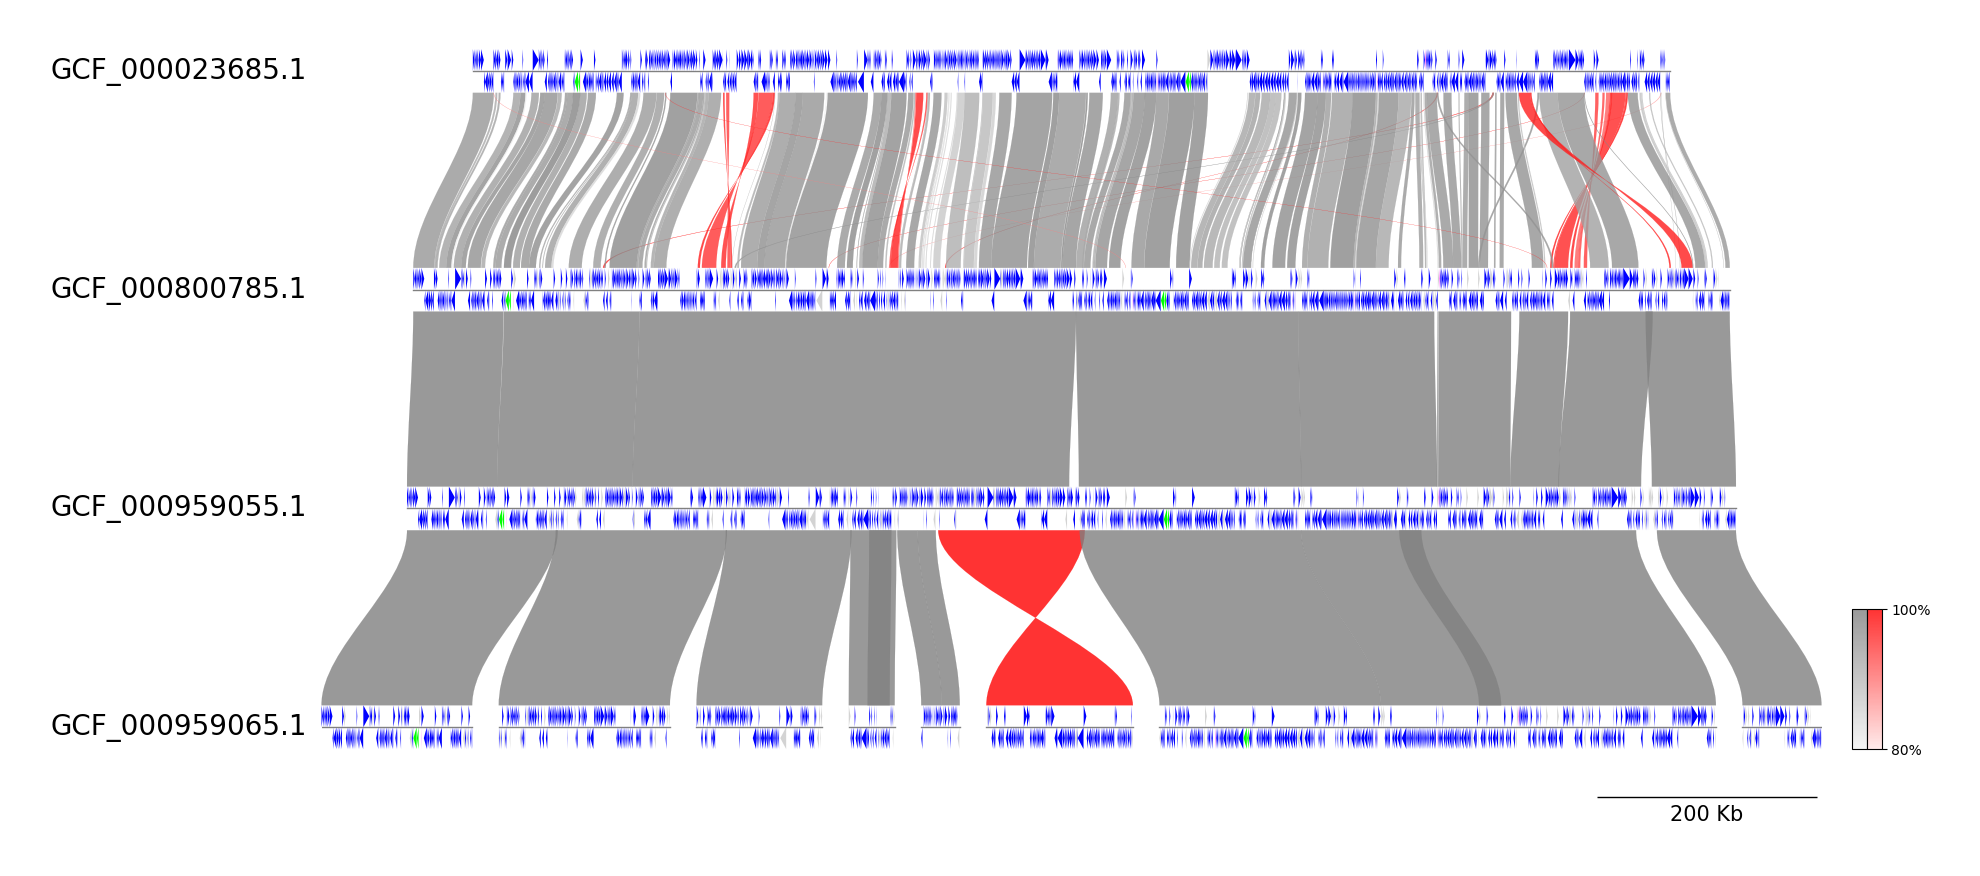
Download example dataset:
pgv-download mycoplasma_mycoides
Run CLI workflow:
pgv-mummer GCF_000023685.1.gbff GCF_000800785.1.gbff GCF_000959055.1.gbff GCF_000959065.1.gbff \
           -o pgv-mummer_example3 --show_scale_bar --curve \
           --feature_type2color CDS:blue rRNA:lime tRNA:magenta